

There are plenty of free tools available for HTML5 quality validation and testing that can and should be used by anybody who produces or buys software products.
Unlike traditional native binary-only apps, with HTML5 apps the user has the ability to access the source code due the technical structure of how HTML5 apps are composed. The source code might not be published with an open license and the source might be obfuscated and minified, but none the less anybody still has the legal right and technical methods to inspect how the app works. One of the benefits is that anybody can do quality assurance and it is no longer restricted to original developers. For example the end user can test how good the app is that he uses, or the procurer can test how high the quality was of the delivered software, or third party auditors can with ease find issues and suggest improvements.
In this article we’ve listed some of the free tools available. With these tips you can go and test all the sites and apps you’ve built, produced, bought or have any other influence on. With the test results you’ll know where those sites stand in terms of quality, and the test results themselves are actionable items you can work on (or request somebody to work on) thus eventually building increasingly better apps and websites.
HTML and CSS quality assurance
The first and most basic thing is to check that the HTML markup is valid and up to date. This can easily be done using the official W3C Markup Validation Service. Useful things like having the alt= attribute on your <img> tags and correctly stating your document type at the start get picked up by this tool.
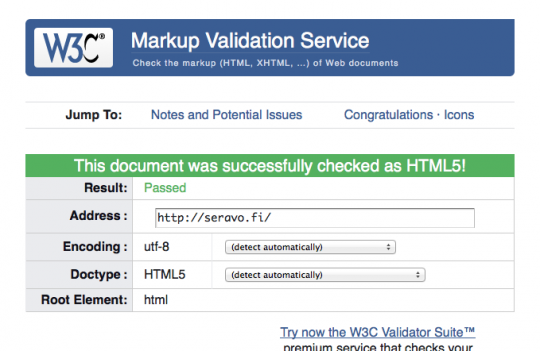
The W3C Validator service
For your CSS validation needs, the W3C also offers a CSS validation tool. The all-in-one Unicorn tester is also worth checking out. There is also a separate mobile checker but it isn’t up to date with modern responsive mobile design methods. There is also a broken link checker.
Microformats
Microformats is a way to embed data in a site in a machine readable format, e.g. an address or product information. A simple hCard Microformat validator by Kornel Lesiński is good specifically for the hCard format while the rich snippets tester by Google is good to validate a larger range of microformats markup, including RDF formats. The Facebook Debugger can analyse Open Graph metadata.
The Google rich snippets tester is a part of a bigger Google webmaster tools suite, which also includes other tools that help webmasters make sure their websites perform great and do not have missing pages (404 errors) or other issues that affect search engine visibility.
A related test suite is provided by SEO SiteChecker that will analyze the search engine optimizations of your site. Two other testers are SEO Analysis Tool and PluginSEO, but they are perhaps a little less useful.
Accessibility
Specialized tools for HTML markup validation from the accessibility point of view exist to help webmasters make sites and apps that can be also used with screen reader devices and other aids. The most popular online testers are: WAVE, FAE, Hera and AChecker.
JavaScript quality assurance
JavaScript is standardized as ECMAScript, but no universal standards validation tool exists. Tools like the original JSLint and the improved fork JSHint are designed primarily to be used by developers working on the unminimized and non-obfuscated JavaScript source, however in combination with tools like JS Beautifier and running standards checking options only, they could be used for generic JavaScript quality checking too.
The minimal thing anybody can do regarding JavaScript quality is to open the built-in browser JavaScript console and check that the JavaScript running in the app/website does not produce any errors. In modern browsers the JavaScript console is a part of a bigger set of tools which can be used to profile and audit the JavaScript running in that browser.
Chrome Developer Tools
Google’s Chrome browser has a pretty comprehensive set of web development aids built right into it. Other modern browsers have very similar development tools like Firebug for Firefox or Safari’s built-in web inspector; however, Chrome’s DevTools is often exceptionally useful due to its more comprehensive list of features and unique tools.
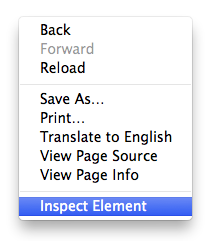
DevTools can be brought up quickly from the right click menu in Chrome.
As you would expect, you can use the web inspector to navigate your DOM and make runtime changes to your HTML and CSS rules. This, of course is useful for making quick adjustments and testing out new features on your page without making any changes to the original files themselves. With the resources panel, you can isolate any individual file loaded on your page and edit it in runtime. It even has built in JavaScript error handling so you can find any JS errors on your page easily.
In addition to runtime editing and error handling, DevTools offers a built in console for JavaScript you can use for both output and input. This is great for debugging all sizes of JS applications. With the sources panel you can even add breakpoints in your JS for a better debugging experience. Have a look at the command line API to fully utilise the DevTools shell.
A slightly less known feature of Chrome’s bundled DevTools is network performance testing. The network panel visualises your page loading times and helps you find slow components for further inspection. For overall performance, the timeline tool visualises all events from from loading resources to parsing JavaScript, calculating styles, and finally rendering the page. This can give you clues for different optimisation vectors on your website.
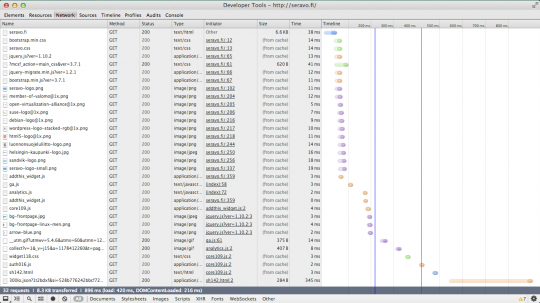
Chrome visualizing the Seravo.fi front page loading times
For Firefox we recommend the extension FireBug.
Faster is better
Speed is a complex thing to get right in HTML5 apps and websites as there are so many components involved from browser features to network connection and back-end servers. For speed testing there are three major open source projects available: PageSpeed (originally by Google), YSlow (originally by Yahoo) and WebPageTest (originally by AOL).
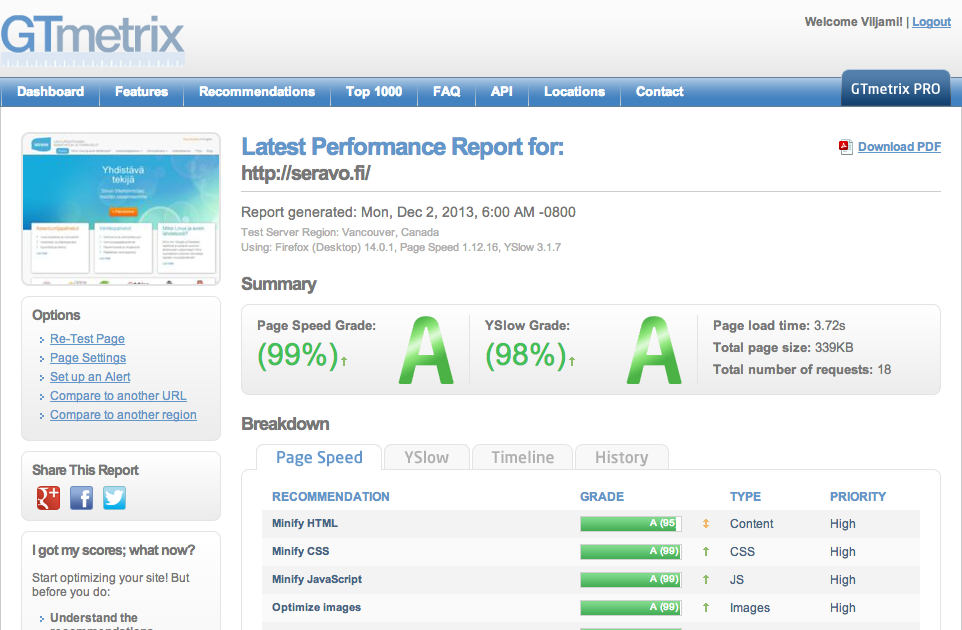
GTmetrix.com
GTmetrix automatically tests your site using both PageSpeed and YSlow. Also the user interface is great and makes gauging your website performance easy and fun. All you have to do is give GTmetrix a URL to look at and let its powerful engine determine the overall performance of the page with a simple 0-100% score. It even keeps track of your score history for reference. This is your comprehensive one stop page performance tool.
GTmetrix results for http://linuxnatives.net
Here are examples of rules YSlow uses to grade your website:
- Minimize HTTP Requests
- Use a Content Delivery Network
- Avoid empty src or href
- Add an Expires or a Cache-Control Header
- Gzip Components
- Put StyleSheets at the Top
- Put Scripts at the Bottom
- Avoid CSS Expressions
- Make JavaScript and CSS External
- Reduce DNS Lookups
- Minify JavaScript and CSS
- Avoid Redirects
Google PageSpeed Insights
PageSpeed Insights is Google’s take on automated page performance analysis. The killer feature that really stands out in PageSpeed Insights tends to be the differentiation of desktop and mobile aspects. The service itself is very similar to the aforementioned gtmetrix and in some aspects a much simplified version of it.
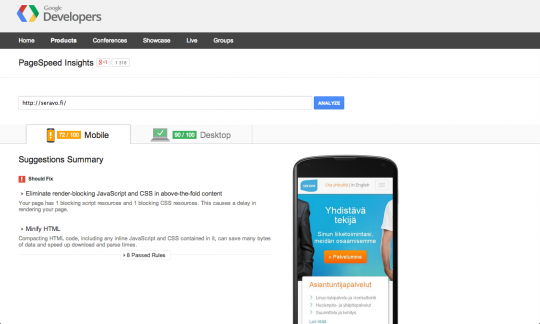
Google’s PageSpeed Insights
This service is utilised with everyone’s favourite analytics source, Google Analytics. Analytics automatically spiders your website and generates PageSpeed Insights reports for each of its subpages. These reports can be found at Behaviour > Site Speed > Speed Suggestions in the Google Analytics web interface. If there isn’t enough data, you can increase the sampling rate by tweaking your tracking code settings.
Other speed analyzers
The Pingdom full page tester is based on PageSpeed, but incorporates also historical data so you can see how a site performs over time.
WebPagetest.org is a free online version of the test suite originally by AOL and a good tool to increase performance once everything recommended by PageSpeed and YSlow is addressed.
Does the site work across all modern browsers?
A quick way to find out is to run a batch of screenshots using different browsers at browsershots.org. For the similar purpose there are also interactive tools like Browserling. As most most problems are related to MS Internet Explorer, a quick way to check out how a site looks with IE is to use IE Netrenderer.
Is your site responsive? Does it work on mobiles and tablets? Test different screen resolutions easily with the Responsinator.
DNS tests, server tests and others
To test the quality of the infrastructure that delivers the HTML5 app in question there are also many tools. The nameserver can be tested for following best practises using DNSInspect.com or Pingdom tools DNS health check. A HTTPS certificate checker is available at DigiCert.
The Red Bot provides a handy server headers analyzer for that can automatically scan all embedded elements (images, CSS files etc).
Nibbler is a very extensive website tester, that not only tests many purely technical thing but also analyses website visibility and social media integration.
Image & Link Analyzer is a quick tool to check that for broken links and images, however the Google Webmaster tools includes somewhat similar features too.
Conclusion
There are many ways to test the quality of websites and HTML5 apps. With so many time saving online services, there is no excuse for you not to do your part in improving the web.
I would like to make you discover our new website tester : http://www.dareboost.com.
We integrate Google Page Speed and YSlow results (as GTMetrix), the W3C validators results and some best practices of our own researches (JQuery usage for instance). I would be very glad to have your opinion on the solution!