To honor the OKFestival currently held in Helsinki, Finland, we’ll publish this week a few articles on open data work we’ve done. You might also bump into some of us at the festival!
By using selection path analysis, we demonstrate that it is possible to create a political campaign with maximum voter popularity.
Media corporations have a lot of influence on society and politics, and unlike some working in the media sector complain, the Internet is not decreasing the media corporations’ influence, but rather give them new tools to increase their influence. Traditionally media has had the power to choose what stories they cover, what politicians they put in the spotlight and thus influence the general population’s minds. The Internet can, and has, added media corporations the ability not just to broadcast to millions of minds, but also to read the minds of millions to see what they think and like. Every browser of the news sites, every scroll, every click can be tracked with website analytics software and turned into exact knowledge of peoples browsing habits and interests.
However there is one source of political information that is above others: the choose-your-candidate-websites. Every visitor to such a website basically profile their political self. In addition to the obvious, showing what candidate or party would match the visitors opinions best, the media corporations could use the data to data mine voter behaviour. Media corporations could for example co-operate with the corporation’s owners favourite party and help it form a campaign that is optimized to appeal to as many voters as possible.
We don’t know if that has ever happened, but in the benefit of public interest the Finnish media corporation Sanoma did a great favour and published for the very first HS Open event in 2011 their dataset from their choose-your-candidate-website from the 2007 Finnish parliament elections as Open Data. Employees of Seravo Oy attended the HS Open event and together with other participants we set up the website Populistipuolue.fi. The site implements the idea presented above: using data on what opinions are most common among voters in Finland, we constructed a hypothetical party program for the Populist Party, designed to guarantee maximum popularity among voters.
The biggest poll ever made in Finland
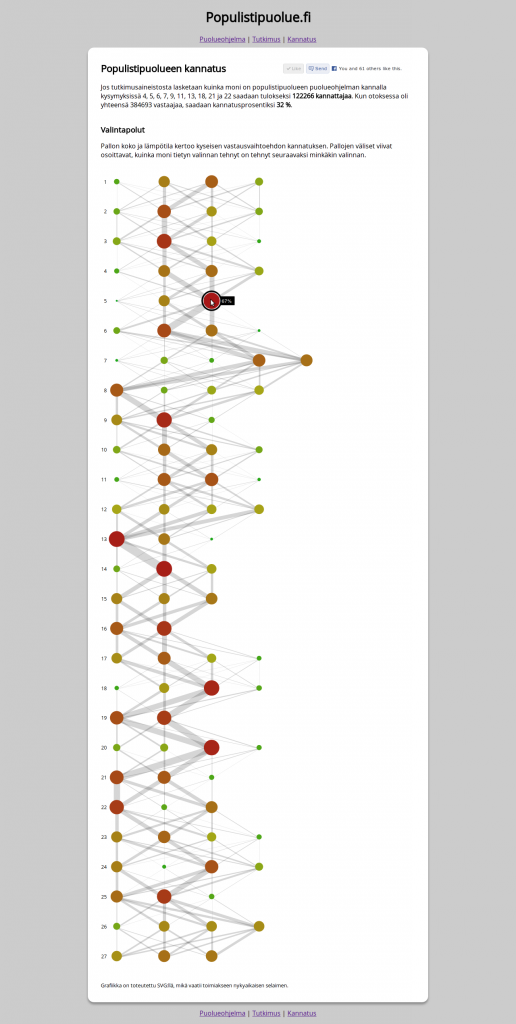
The huge dataset, probably the biggest poll ever made in Finland, contained the answers of over 384 000 respondents (almost 15 % of the adult population in Finland). The populist party program was carefully drafted analysing decision paths using a novel selection path visualization invented for the purpose and implemented using the gRaphaël JavaScript SVG library (and works only on SVG supporting browsers, not Internet Explorer). As any other proper open data thing, the visualization is of course open source and available at GitHub. The visualization shows as grey lines the amount of people who had which selections if to consecutive selections. The analysis of longer paths, spanning several sections was done as database queries. This approach was vital, since to actually get people to vote for the Populist Party one cannot simply choose any random opinions that have gain broad support, since some of those opinions might be of opposite nature. The party program must be written so that that as a whole it has the maximum popularity.
Using the selection path analysis we chose 10 opinions on different matters and, using the dataset, concluded that there would be 122 000 people with exactly those opinions, giving a popularity level of 32%, bigger than any current real party in Finland. With a little campaigning to get on on its side also those who shared the opinions only to an extent of 70-90%, the populist party could easily get huge support percentages.
If you know Finnish and read the party program at the Populistipuolue.fi main page, you’ll be likely to like it.


