

Who would not want to have a fast service? No matter how good your web service is, if it takes 5 seconds to load a page, people will dislike using it. Even search engines dislike slow servers and decrease their ranking. Faster is always better. In our article a few months ago we asked what is the fastest web server in the world. The results combined with other arguments (open source, ease of use, security) lead us to decide on using Nginx as our preferred general web server for new web services. However, choosing the software is only the first step on the path to blazing fast web services. Here are some tips on how to optimize Nginx for serving static files and dynamic PHP content.
Metrics and validated learning
When trying to improve something, it is essential to find a way to measure it first. How can you be sure there was any improvement if there is no metric to prove it? Trying to improve something without metrics is most of the time just random and wasted work, and even at best only application of old knowledge. Metrics enables also the persons doing the measurement to learn from each iteration and perhaps discover something new and take the world one small step forward.
In context of web server speed our primary metric is server response time, that is, the time it takes for the server to start sending content in reply to the visitors request. A good tool for testing just that is Apache Bench (command ‘ab’) and as it is rather old and mature, it is available from pretty much any Linux distribution’s repository.
In our case there are two distinct scenarios for response time. The simple one is when a static file is requested (e.g. CSS, image, JavaScript) and the web server only has to parse the request URI, fetch the file from the file system and send it away. The second and more complex case is when there is dynamic content: the web server parses the URI, notices it’s meant for a PHP file, passes the request via FastCGI to the PHP processor. The PHP processor can in turn do more complex things, like query a database for information to be included in the response. Finally when the PHP processor is done, the web server passes the result back to the browser that requested it.
Using Apache Bench we benchmarked the server by requesting a single CSS file thousands of times in succession, and varying the count of concurrent connections. An example command that downloads a CSS file 8000 times using 100 concurrent connections is:
$ ab -n 8000 -c 100 -g css-original.dat http://linuxnatives.net/css/style-print.css
Requests per second: 17862.37 [#/sec] (mean)
Time per request: 5.598 [ms] (mean)

The process for any static file is the same, so there is not much point in benchmarking many different static files. In the second scenario however the response varies a lot depending on what the PHP code in question executes, so to benchmark it we choose to measure the response of the main page and our blog page.
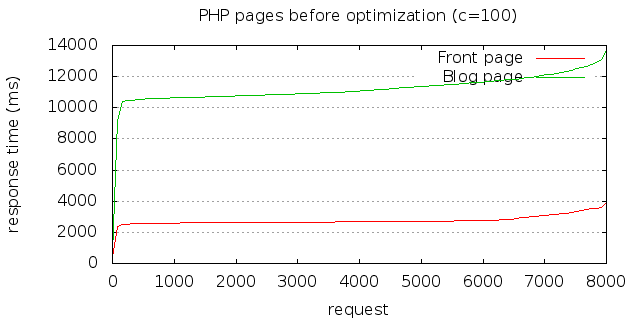
This illustrates very well how much heavier the serving of PHP pages is. With 100 concurrent requests arriving all the time the server resources are quickly saturated, so we did another benchmark using only 10 concurrent requests doing 80 requests in total:
$ ab -n 80 -c 10 -g etusivu-original-min.dat http://linuxnatives.net/
Requests per second: 34.04 [#/sec] (mean)
Time per request: 293.776 [ms] (mean)
$ ab -n 80 -c 10 -g blogisivu-original-min.dat http://linuxnatives.net/
Requests per second: 26.50 [#/sec] (mean)
Time per request: 377.311 [ms] (mean)

Comparing the 6 milliseconds of a static page to on average 300 milliseconds of a PHP page tells us that serving PHP is 50 times heavier and an obvious goal for our optimization.
Nginx general settings
As the virtual server in question has two CPU cores, the first thing to do was to match the Nginx worker process count to that we changed in /etc/nginx/nginx.conf:
worker_processes 2;
For visitor statistics we use an external service, that tracks the pages mostly via JavaScript, so a separate access log is not needed:
access_log off;
Nginx has the option to cache file descriptors, meaning that if the same file is accessed many times, Nginx will be able to fetch in faster from the file system.
open_file_cache max=1000 inactive=20s;
open_file_cache_valid 30s;
open_file_cache_min_uses 2;
open_file_cache_errors on;
All of these optimizations are likely to effect the total request time by just a few milliseconds, so using the static file benchmark possible small changes were more prominent, but still changes on the scale of 5 ms to 4 ms are really tiny:

The option multi_accept makes the worker process accept all new connections instead of serving on at a time:
multi_accept on;
A huge keepalive in turn makes the server keep all connections open ready for consecutive requests:
keepalive_requests 100000;
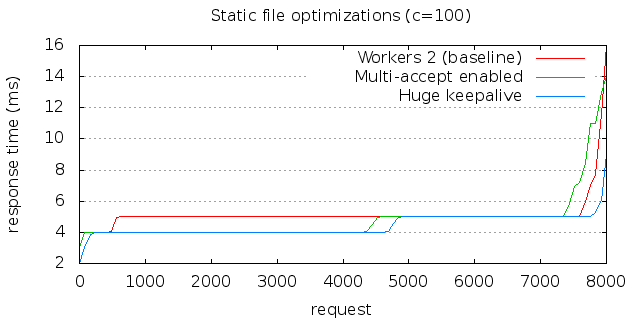
Again, results are minimal. The jumps between 4000 and 5000 for the two changes reflect the point where the response time is rounded to 5 instead of 4 milliseconds.
Gzip: no compression, on-the-fly-compression and pre-compression
It costs some CPU for the web server to compress the output with gzip before sending it out to the client, so we might want to disable it, but on the other hand compressed data during transit is a such a big benefit. To save the web server from over and over gzipping content on per-request-basis, Nginx has an option that makes the server to check if a .gz-ending version of a file exists. If it does, it is sent as the response instead. This enables us to pre-compress static files (but that has to be done with another custom program).
At the moment we have configured this:
gzip on;
gzip_static on;
Be aware of the cost of these options we benchmarked the situation with either or both off:
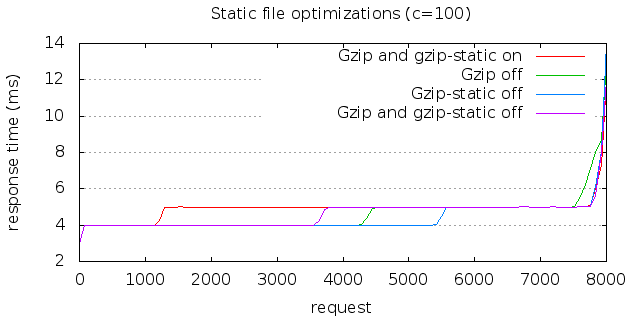
All we can conclude from this, is that the differences are so small they are irrelevant. For now we’ll have both options enabled and later we should do benchmarks with different file types and sizes to determine optimal gzip usage on a larger scale.
Nginx, PHP-FPM, APC, FastCGI and FastCGI cache
Nowadays the only viable option to run PHP on Nginx is via FastCGI using the PHP FastCGI Process Manager. For PHP acceleration there are still some other options too, but APC is officially endorsed by the core PHP developers and will be built-in as of PHP6. For optimization APC and FastCGI cache are most interesting.
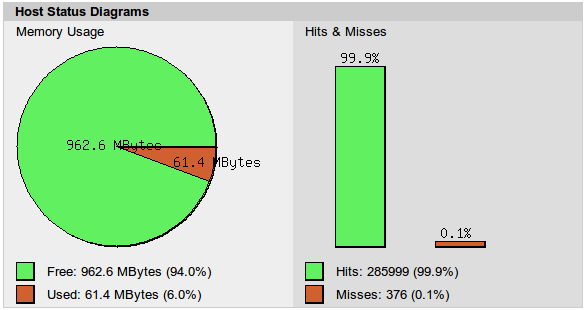
Depending on your distribution you should have be able to copy the file /usr/share/doc/php-apc/apc.php (or .gz) to your web server root and then view it so see how you PHP object cache performs:
By default the cache was very small and quickly got filled, leading to an inferior cache hit/miss rate. First setting the cache size to 1 gigabyte with option apc.shm_size=1000 in your php.ini and then running some load on the server showed that there is about 60 MB of cacheable objects and then miss-ratio was less than 1%. Eventually in this case setting the cache size to 100 MB was the optimal solution, as we don’t want to waste RAM either.
Fastcgi cache in Nginx
Last, but certainly not least, is the most amazing optimization available for PHP in Nginx: FastCGI cache. With this enabled Nginx omits executing PHP altogether if the requested URL has recently been requested and that result contained headers that allowed caching. As our earlier article on web server speed showed, Nginx servers static files faster than e.g. Varnish, and with this built-in proxy feature available, there is no real need to put Varnish in front of Nginx. In fact, Varnish as an extra step would only slow things down and increase point of failures.
To enable it first add in the main nginx.conf the line:
fastcgi_cache_path /var/cache/nginx levels=1:2 keys_zone=microcache:10m max_size=1000m inactive=60m;
Also make sure that the defined path exists and the user id running the web server has write access to it.
Then enable the cache in the site configuration files options like these:
server {
[...]
  set $cache_uri $request_uri;

  # POST requests and urls with a query string should always go to PHP
  if ($request_method = POST) {
    set $cache_uri 'null cache';
  }
  if ($query_string != "") {
    set $cache_uri 'null cache';
  }

  # Don't cache uris containing the following segments
  if ($request_uri ~* "(/wp-admin/|/xmlrpc.php|/wp-(app|cron|login|register|mail).php|wp-.*.php|/feed/|index.php|wp-comments-popup.php|wp-links-opml.php|wp-locations.php|sitemap(_index)?.xml|[a-z0-9_-]+-sitemap([0-9]+)?.xml)") {
    set $cache_uri 'null cache';
  }

  # Don't use the cache for logged in users or recent commenters
  if ($http_cookie ~* "comment_author|wordpress_[a-f0-9]+|wp-postpass|wordpress_logged_in") {
    set $cache_uri 'null cache';
  }

  location ~ \.php$ {
    ##
    # Fastcgi cache
    ##
    set $skip_cache 1;
    if ($cache_uri != "null cache") {
      add_header X-Cache-Debug "$cache_uri $cookie_nocache $arg_nocache$arg_comment $http_pragma $http_authorization";
      set $skip_cache 0;
    }
    fastcgi_cache_bypass $skip_cache;
    fastcgi_cache microcache;
    fastcgi_cache_key $scheme$host$request_uri$request_method;
    fastcgi_cache_valid any 8m;
    fastcgi_cache_use_stale updating;
    fastcgi_cache_bypass $http_pragma;
    fastcgi_cache_use_stale updating error timeout invalid_header http_500;

    ##
    # WordPress PHP
    ##
    try_files $uri /index.php;
    include fastcgi_params;
    fastcgi_read_timeout 300;
    fastcgi_pass unix:/var/run/php5-fpm.sock;
  }
}
The results speak for themselves:
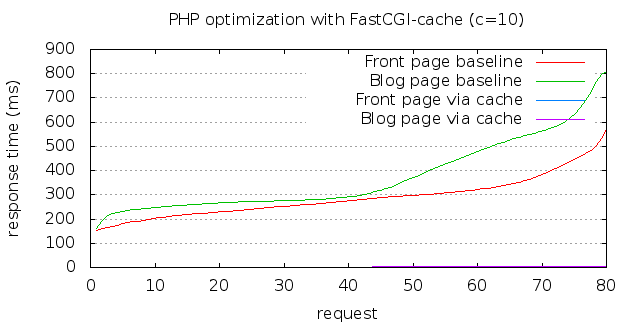
The difference is so big, that the cached page speeds are barely visible at the bottom of the graph.
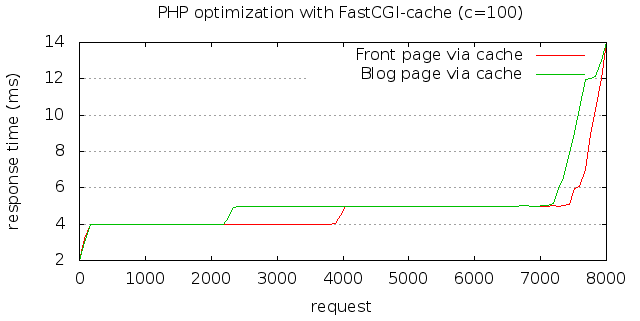
This graph shows that the FastCGI cache scales as well as if Nginx was serving static files.
More optimization
There is still a lot more to optimize. We could tune the network stack parameters of Linux. We could mount the www directory and cache directories as RAM disks using tmpfs, so that all files would reside in RAM all of the time. Using 32-bit binaries memory usage would be lower. Some PHP apps could be precompiled into bytecode. We could fine tune the settings of PHP-FPM and most importanlty we could fine tune the settings of the database server that PHP uses to store and retrieve data. We are likely to return to these later – stay tuned!
All of the components mentioned before constitute the infrastructure part, and any application will benefit from optimized infrastructure, let it be WordPress, Drupal, Joomla, Moodle, MediaWiki, Roundcube, Magento, SugarCRM, Kolab Groupware or whatever. Still, it is the application itself that has the biggest influence of its speed and performance. If it generates big outputs, parses and traverses complex structures, makes hundreds of database queries etc then it will stay slow. For the FastCGI cache (or any cache actually) to work the application needs to have sane headers with expiration times and no unnecessary cookies set.
In the above example the application is WordPress and there are some WordPress-specific options. In the case of WordPress there are also plugins available, like the W3 Total Cache, which prepares the output from WordPress to be smaller and easily cacheable.
Finally, to make sure that you web server stays fast and to spot any sudden changes, use some kind of monitoring solution that loads several subpages of your site at regular intervals. At Seravo we use Zabbix.

At first Apache Bench is NOT single standalone, it comes with standard Apache Installation. There is some package library if you want to install standalone but that non-relavant. But to test server response time with ab- is not optimistic, as ab- is single threaded, which cannot measure the Nginx performance across multiple threads… better use httperf or JMeter, and publish the result once again…..
Thanks for your comment! It is true, the results are not perfect since the differences are too small and we apparently hit the limits of the testing tool Apache Bench rather than the target systen we are testing. We should redo these benchmarks using httperf and higher loads.
I don’t know how I ended up in your blog, anyways, I sound rude in my previous comment, sorry for that !!!
I went through your post once again, here are few suggestions for better high traffic performance:
multi_accept off # if you do on, all the processes will be active once the request is made. Usually request is received by main process and sent to child process, if you do ON, then all child processes tries to grab the request, this makes wastage of process tiggers.
It’d be better to use: accept_mutex on; see Nginx wiki for that.
You should also do cache_errors off # Not to show naughty errors to site users.
Nginx takes only 10kb memory to store inactive connections, so, keeping the connection alive for 10000 seconds will make Nginx like Apache. I’d decrease it to 10 seconds…. Nginx have deprecated use of single value keepalive in latest version. It’d be great to see your other benchmarks… i’ll be waiting !!!
JMeter is an overly complex Java GUI program, so I didn’t feel compelled to try it. Httperf seemed better, though the development of it has been stalled since 2007 (at version 0.9). I would be glad to tips on better testing tools!
Httperf failed to run at all when testing more than 30000 requests, but for 30000 it still worked and the result is below, but shows as speed only about 13 thousand requests per second compared to the Apache Bench tests above with about 20 thousand requests per second.
Turns out if I increase the –num-calls -parameter in httpref to an equivalent amount of concurrent connections as in the AB tests, then httpref also comes up to 20 thousand requests per second but does not grow above that. So I conclude that AB was not a bottle neck at least compared to httperf. There is however still a need for better benchmarks (and tools).
$ httperf –hog –server seravo.fi –num-conn 30000 –uri /css/style-print.css
httperf –hog –client=0/1 –server=seravo.fi –port=80 –uri=/css/style-print.css –send-buffer=4096 –recv-buffer=16384 –num-conns=30000 –num-calls=1
httperf: warning: open file limit > FD_SETSIZE; limiting max. # of open files to FD_SETSIZE
Maximum connect burst length: 1
Total: connections 30000 requests 30000 replies 30000 test-duration 2.269 s
Connection rate: 13220.5 conn/s (0.1 ms/conn, <=1 concurrent connections) Connection time [ms]: min 0.0 avg 0.1 max 4.5 median 0.5 stddev 0.0 Connection time [ms]: connect 0.0 Connection length [replies/conn]: 1.000 Request rate: 13220.5 req/s (0.1 ms/req) Request size [B]: 81.0 Reply rate [replies/s]: min 0.0 avg 0.0 max 0.0 stddev 0.0 (0 samples) Reply time [ms]: response 0.0 transfer 0.0 Reply size [B]: header 308.0 content 66.0 footer 0.0 (total 374.0) Reply status: 1xx=0 2xx=30000 3xx=0 4xx=0 5xx=0 CPU time [s]: user 0.25 system 1.99 (user 10.9% system 87.6% total 98.5%) Net I/O: 5874.3 KB/s (48.1*10^6 bps) Errors: total 0 client-timo 0 socket-timo 0 connrefus
Yes, development of is pretty stalled (I got somewhat busy and benchmarking tools are a little bit dull to develop).
That said, the version on google code has some experimental work done on it to support libevent, which allows for a great deal more performance.
At some point, I’ll take the time to entirely re-write httperf to use libevent at its core, which should allow experimental machines to induce a great deal more load.
Of course, if someone wants to send me a couple grand (CAD), I’d be happy to do it next month.
Anyway, take care.
I could recommend a few more, as I was performing some benchmarks on may Web Servers. Its known that AB is single threaded, but I think it doesn’t matter as long as it can “stress” a server even a little (or in a single core way) .
– siege [https://www.joedog.org/siege-home/]
– wrk [https://github.com/wg/wrk]
– weighttp [http://redmine.lighttpd.net/projects/weighttp/wiki]
– httperf [http://www.hpl.hp.com/research/linux/httperf/]
– httpress [https://bitbucket.org/yarosla/httpress/wiki/Home]
By the way, in my personal benchmarks the winner was Gwan Web Server [gwan.ch]. If someone is interested on detailed info.
what the system ulimit says ? does your hardware support 30000 requests at a time ? in most scenarios hardwares are bottlenecks. Your log might give information about what happened when you set requests more than 30000 (processed page would be stored in access log if set on, and errors in error log), in other case, your result set in httperf looks perfectly equivalent to that of ab. They display result differently.
AB was built in 1998, and I guess, its not actively maintained too, as it doesn’t really have to be, it gives good result for single page load test, but when it comes to site test it becomes unreliable. same goes with httperf, though not actively maintained it is still perfect tool for load testing, you can use “Autobench”, which is just wrapper on top of httperf.
Personally I use all available tools, Siege, Curl for web server, Polygraph for cache, sysbench for mysql…. though the result set they produce is quite different, but still gives some result so I can benchmark again with those set of tools after changing configs… I still feel the best by far till now is jMeter. Although Java based and bit complicated, but it gives much realistic result of the system in the runtime.
Great article. Unlike some other people, I’m glad that people like you take the time to share this with us. I learnt a lot.
Thanks.
Thank you guys for the configs and sharing the testing results. It was really helpful for me today.
Any idea why i am seeing the following error:
nginx: [emerg] unknown directive “fastcgi_cache_path” in /etc/nginx/nginx.conf:12
nginx: configuration file /etc/nginx/nginx.conf test failed
I added the /var/cache/nginx directory
Thanks
It turns out i placed the “path” line outside the “http” option. The “fastcgi_cache_path” line goes here:
http{
fastcgi_cache_path /var/cache/nginx levels=1:2 keys_zone=microcache:10m max_size=1000m inactive=60m;
}
Hopefully this helps other people that don’t spend all day playing with server configs.
At any rate, i was still unable to find a home for the server{ } settings, as i don’t have an /etc/nginx/sites-available/default directory on my server and i can’t find any other info on where this would go… “in the site configuration files options” is quite vague.
Why disable access_log?
The disk IO saved from skipping the access_log write only saves a fraction of a millisecond per request. I can see disabling it selectively for things like robots.txt, favicon.ico, etc. but disabling it globally is just asking for trouble…
I don’t know the last time you looked at your access log but mine is filled with bruteforce attacks, SQL injection attempts, etc. Given that most of these attacks are completely automated and executed from the command line, they have no concept of Javascript to trigger your front-end analytics scripts. When your database gets hacked or somebody manages to vandalize your site, you’ll have no way of backtracking where the attack came from. From a liability perspective, if you leak customer information and have nobody to point the finger at, you open yourself up to negligence lawsuits.
Please don’t recommend such a bad practice to people who might blindly copy your recommendation without understanding the potential consequences (or at least give them a warning!)
Otherwise good article
I agree
@DrewHammond: Thanks for the comments. You are right, everybody will be better of with the access log enabled. The performance benefit is minimal and not being able to audit all traffic is a big drawback.
Thank you guys for the configs and sharing the testing results. It was really helpful for me today.
omg.
you really saved my website
thanks to you all. i did the things above and its really helped
also do not forget and add aio on; too.
thanks
Your post is really informative. The test results are convincing as well.
Thank you for sharing.
terible config i use it with 7000 user online bad change fastcgi config
location ~ \.php$ {
try_files $uri =404;
fastcgi_split_path_info ^(.+\.php)(/.+)$;
fastcgi_pass unix:/var/run/php5-fpm.sock;
fastcgi_index index.php;
include fastcgi_params;
fastcgi_intercept_errors on;
fastcgi_ignore_client_abort off;
fastcgi_connect_timeout 60;
fastcgi_send_timeout 360;
fastcgi_read_timeout 360;
fastcgi_buffer_size 128k;
fastcgi_buffers 8 256k;
fastcgi_busy_buffers_size 256k;
fastcgi_temp_file_write_size 256k;
}
HI Otto,
How to measure php fpm children? do you have any article based on that?
Thanks